Running Llama 3.1 8B with FP8 on vLLM Cuts Cost from $1.00 to $0.36 per Million Output Tokens
A completely untouched vllm serve of Llama-3.1-8B costs $1.00 per million output tokens on a rented
L4. Turn on FP8 quantization and that drops to $0.36, a 64% cut. Nothing else I tested added anything
further, and one setting (--max-num-seqs, the request-concurrency cap) actually got worse before I
measured it properly.
The boring reason your bill is high
Most inference bills are high for a boring reason: someone ran vllm serve <model>, it worked, and
nobody measured it again. vLLM already does more for you by
default than most people realize. Quantization isn’t one of those things. Knowing which is which is
the entire value of measuring instead of assuming.
I’m publishing the full method, not just the number. The scenario is deliberately ordinary — the kind of deployment I’d expect to find in production, not a strawman.
What I’m serving
- Model: Llama-3.1-8B-Instruct, at
vLLM’s default
bfloat16— the workhorse 8B, not because it’s the best model for every task (if you’re picking one from scratch, benchmark something newer), but because it’s what a lot of production self-hosters are already running. This audit is about the infra under whatever model you’re serving, not a model recommendation. - Hardware: one NVIDIA L4 (24 GB), rented from Jarvislabs at ₹41.31/hr (~$0.44/hr). One GPU, so the cost math stays clean.
- Workload: synthetic, generated via
vllm bench serve --dataset-name random, shaped to match a RAG traffic pattern: 2,000 input tokens per request, a 500-token prefix genuinely shared across every request (standing in for a repeated system prompt), 1,500 tokens of random context (standing in for retrieved chunks), and 150-token completions. - What I measure, every run: throughput (output tok/s), cost per million output tokens at full
utilization (
GPU $/hr ÷ (output tok/s × 3600) × 1e6— a capacity-cost floor for this request shape, not a literal bill), and TTFT/end-to-end latency. Every run: a 50-request warmup (discarded), then a timed pass, repeated 3×, median reported.
Two rates, not one
One thing worth knowing before any of the numbers: every config in this post is measured twice, at genuinely different request rates.
The obvious way to benchmark a handful of configs is one fixed rate everywhere: warm up, fire requests at that rate, measure. I tried that first, at a rate gentle enough for the slowest config to keep up — every config landed within 1-2% of each other on cost per token. At a rate that gentle, the slowest config never falls behind, so every config trivially keeps up, and you end up measuring “cost when nothing is under load” — which erases the exact signal a cost audit needs.
So every config gets measured at two loads, reported separately, never blended:
- Light load (a fixed 0.2 req/s — light in the sense of “the box isn’t queueing,” not a claim it matches any real traffic trace) — the number for latency. Replace this rate with your own measured arrival pattern on your own deployment.
- Saturation (fire everything immediately, no pacing) — the number for cost and capacity: how much this box can actually do.
This isn’t what caught the concurrency mistake later in this post — that took a third, more basic check.
What untouched vLLM actually costs
Before touching anything, I measured the real default:
vllm serve meta-llama/Llama-3.1-8B-Instruct --max-model-len 4096 --gpu-memory-utilization 0.85(The --max-model-len cap isn’t optional here: Llama-3.1-8B-Instruct defaults to a 131,072-token
context, and vLLM sizes its KV cache to guarantee it can serve one request at that length — 16 GB of
KV cache reserved against a 24 GB card, on top of ~15 GB of weights. Uncapped, the server doesn’t
start. The workload here never exceeds 2,150 tokens, so capping to a realistic length is itself the
first real finding, not a workaround.)
This command already has prefix caching and chunked prefill turned on — both are vLLM 0.25’s actual default, whether you ask for them or not. What it doesn’t have is quantization.
| Metric | Light load | Saturation |
|---|---|---|
| Output throughput (tok/s) | 29.24 | 122.17 |
| p90 TTFT | 615 ms | 67 seconds |
| p50 end-to-end | 10.9 seconds | 59.5 seconds |
| Cost / M output tokens | $4.18 | $1.0004 |
At light load the box barely works, so cost per token is dominated by mostly-idle capacity — the $4.18 figure says more about arrival rate than about the model. At saturation, with the GPU actually busy, the real number is $1.00 per million output tokens. That’s what the rest of this post is measured against.
Turning on FP8
Turning on FP8 for both weights and KV cache is a single pair of flags:
vllm serve meta-llama/Llama-3.1-8B-Instruct --max-model-len 4096 --gpu-memory-utilization 0.85 \
--quantization fp8 --kv-cache-dtype fp8| Metric | Untouched default | + FP8 |
|---|---|---|
| Throughput at saturation (tok/s) | 122.17 | 337.39 |
| Cost / M output tokens | $1.0004 | $0.3623 |
That’s a 64% cut, and it’s basically the entire story. Prefix caching and chunked prefill were already included in the $1.00 baseline, so they don’t get to claim any of this drop — quantization is the only lever a genuinely untouched deployment is actually missing, and it accounts for nearly all of the savings available on this hardware.
Llama-3.1-8B-Instruct isn’t an FP8-native checkpoint, so it ships no KV scales of its own, and I
didn’t pass --calculate-kv-scales either. Per vLLM’s own documentation,
that combination means every k_scale/v_scale defaulted to 1.0 — the least-calibrated setting
available. If you’re deploying this for real, calibrate KV scales for your checkpoint, or at least
confirm your version’s default matches this uncalibrated behavior. I’ve since measured the fp8 KV
lever in isolation on this same GPU: KV capacity exactly doubles,
and decode gets faster as context grows — up to 28% at 32k.
Quantization is also the only lever here that can change the model’s actual answers, so I checked it: 20 RAG-shaped context blocks, each with one unique fact planted in it, asked to recall the fact, scored by exact-substring match.
| bf16 | FP8 | |
|---|---|---|
| Fact-recall accuracy | 20/20 | 20/20 |
Every item, both models got right. This is 20 deterministic, single-fact-extraction items, not a broad quality benchmark — it’s evidence against the specific failure mode I was checking for (quantization breaking fact retrieval from long context), not proof it can’t happen elsewhere. Check a broader eval on your own task before assuming it transfers, ideally on real retrieved documents rather than this synthetic proxy.
Where the rest of the gain comes from
To see each piece separately — not just “default vs. everything on” — I also built a fully de-optimized control: quantization off, prefix caching off, chunked prefill off, all explicitly disabled. This isn’t what a real deployment looks like (the real default already has two of these on), but it lets each lever’s individual contribution show up cleanly.
| Metric | All-off control | + FP8 | + Prefix caching | + Chunked prefill |
|---|---|---|---|---|
| Throughput at saturation (tok/s) | 93.72 | 255.35 | 327.65 | 333.01 |
| Cost / M output tokens | $1.30 | $0.48 | $0.37 | $0.367 |
FP8 cuts cost 63% relative to this all-off control — nearly identical to the 64% cut measured against
the real default above, which is a good cross-check: two very different starting points agree on
FP8’s actual size. Prefix caching adds a further real gain: TTFT drops another 24%, well outside the
~2ms pass-to-pass spread. It’s also the lever most dependent on your actual traffic, since it only
helps to the degree your requests share content. Chunked prefill (measured here together with an
explicit --max-num-batched-tokens 2048, since the two aren’t separable in this test) adds a small
further throughput gain (1.6%) but no tail-latency improvement on this workload — p99 TTFT actually
ticks up slightly, from 562.58ms to 567.42ms, despite tail-latency protection being chunked prefill’s
usual job.
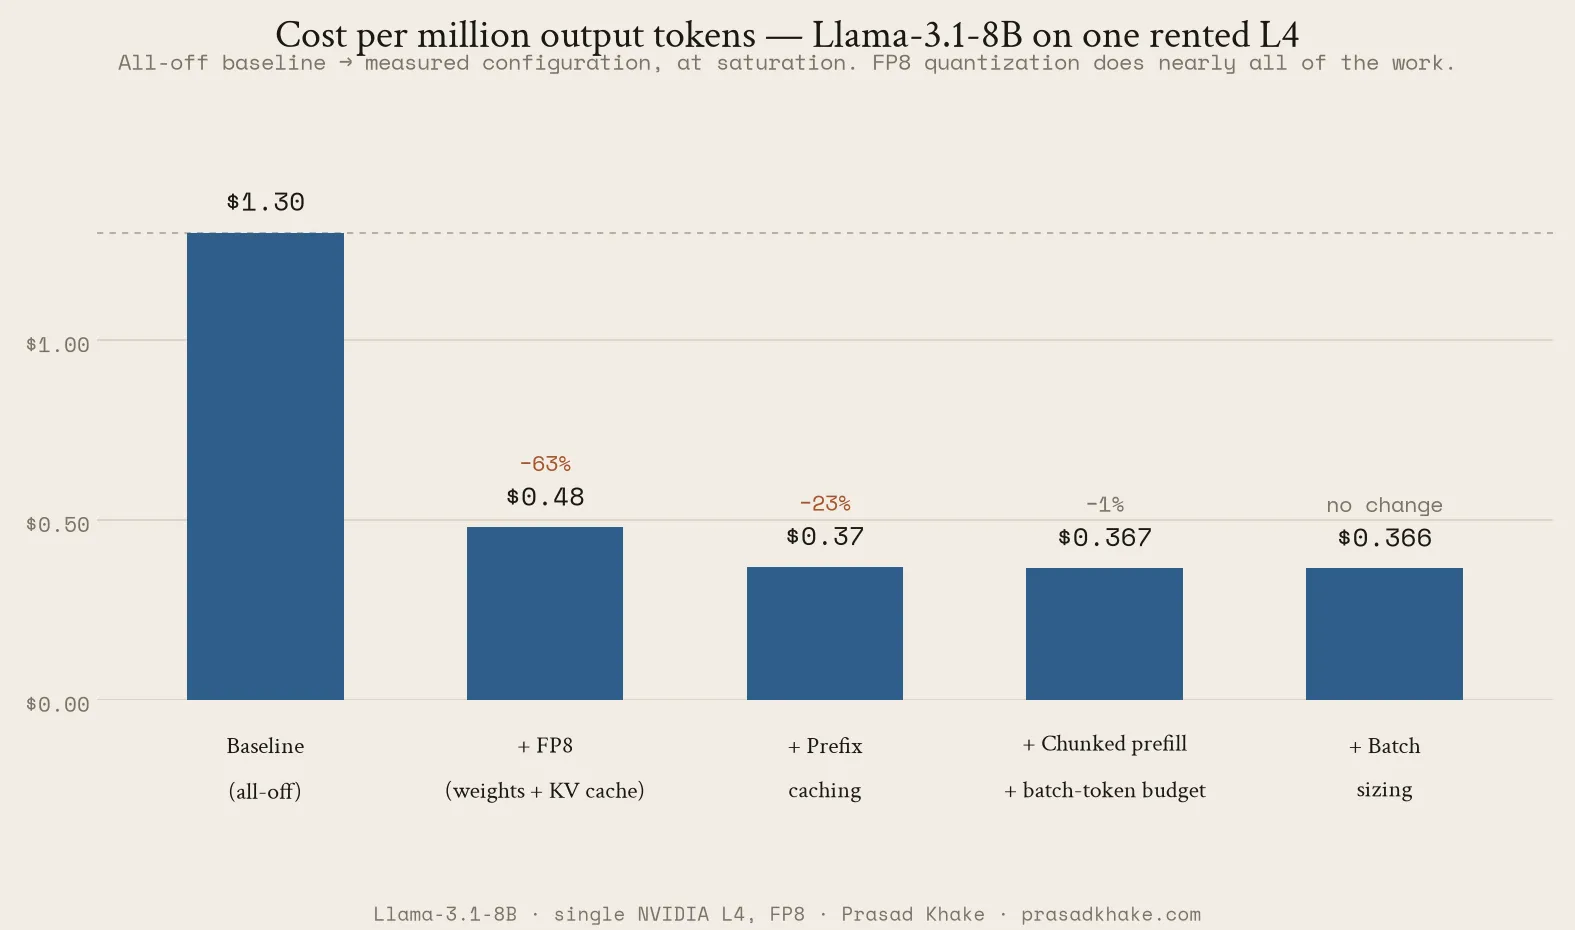
Cost per million output tokens, all-off control → measured configuration, at saturation. FP8 does nearly all of the work; prefix caching is the second real, distinct step; chunked prefill adds a small further gain; batch sizing lands within noise of that last step.
| Step | Cost / M tok | Cumulative saving vs. all-off control |
|---|---|---|
| All-off control | $1.30 | — |
| + FP8 | $0.48 | 63.3% |
| + Prefix caching | $0.37 | 71.4% |
| + Chunked prefill | $0.367 | 71.9% |
The natural next question is whether tuning batch size adds anything further. It doesn’t — but getting there took a wrong turn first.
The setting that went backwards before it went nowhere
FP8 frees up several GB of memory. Spare memory can let more requests run concurrently, and more
concurrency can raise throughput on a memory-bound GPU — but neither step is automatic. The obvious
move is to raise the concurrency ceiling (--max-num-seqs) and expect a further gain.
My first guess was 64:
| Metric | + chunked prefill | + batch (guessed: 64) |
|---|---|---|
| Throughput at saturation (tok/s) | 333.01 | 301.07 |
| Cost / M output tokens | $0.367 | $0.406 |
That’s a regression. An “obviously reasonable” concurrency cap made the deployment worse than not touching the setting at all. The only way I caught it was by comparing this config’s saturation throughput directly against the previous step’s — a basic sanity check, not the two-load methodology above. So I swept the parameter properly instead of trusting the guess.
The first sweep used the same request count as every other measurement in this post — 75 timed
requests per pass. That was a mistake: at saturation, realized concurrency can never exceed the
number of requests fired, so any --max-num-seqs value at or above 75 was never actually tested
against a real constraint. They tied because none of them ever bound, not because the curve had
flattened. I reran the sweep at 600 requests per pass — large enough for a cap of 512 to actually mean
something:
--max-num-seqs | 64 | 128 | 256 | 512 | flag omitted (default) |
|---|---|---|---|---|---|
| Throughput (tok/s) | 322.19 | 337.44 | 337.79 | 333.31 | 337.39 |
| Cost / M output tokens | $0.3793 | $0.3622 | $0.3618 | $0.3667 | $0.3623 |
The real shape: 64 is genuinely worse than everything above it. 128, 256, and the default cluster together — a real plateau this time, not a tie caused by an undersized test. And 512 is a small but real step backwards, about 1.3% below the 128–256 band — past a certain point, more concurrency stops helping and starts costing a little, plausibly from scheduling overhead on batches that no longer fit the sweet spot.
The practical takeaway: guessing low costs you, guessing very high costs you a little too, and the
safest move is to leave --max-num-seqs alone or land it in the 128–256 band — which is almost
exactly where vLLM’s own default already sits.
Outside this audit’s scope
The biggest cost lever is often not on this list: does the task need an 8B at all? A well-tuned 3B, or a fine-tuned smaller model, can match an 8B on a narrow RAG task at a fraction of the cost — but that changes the model, and this audit was scoped to infra levers on the same model, not a claim that outputs are provably unchanged beyond the narrow probe above. It’s usually the first question worth asking, and frequently the largest single saving — it just isn’t free, since it needs a task-specific quality eval of its own. Speculative decoding is the same kind of story: real latency wins on the right traffic, but enough moving parts that it belongs in its own post, as I found on the M3.
What this means for your bill
If you’re serving an open model and haven’t re-measured since it went live, there’s a real chance the FP8 gap alone is sitting on your bill — to the extent your GPU-hours are actually near saturation. If they’re not, the real finding on your deployment is probably utilization, not any flag in this post.
And if the last time anyone touched a concurrency or batch setting they picked a number that “seemed reasonable” and moved on, there’s a real chance that’s costing you throughput right now, in either direction, on the hours you are near saturation. The only way to know is to check.
How I measured this
- GPU: single NVIDIA L4, 24 GB, Jarvislabs, on-demand ₹41.31/hr (~$0.44/hr).
- Software: vLLM 0.25.0 (flags and defaults move between versions — check
vllm serve --helpandvllm bench serve --helpagainst yours, and check what’s on by default before calling anything a “baseline”). - Driver:
vllm bench servewith--dataset-name random,--random-prefix-len 500(shared, cacheable prefix),--random-input-len 1500 --random-range-ratio 0(fixed 1,500-token variable context),--random-output-len 150,--ignore-eos(forces exactly 150 output tokens every request, so configs are compared on identical work). - Two request-rate regimes:
--request-rate 0.2(light load, for latency) and unbounded/inf(saturation, for cost/throughput) — see “Two rates, not one” above. - Protocol: 50-request warmup (discarded, same size every pass), then a timed pass, repeated 3×,
median reported. A fresh server for every pass, not a shared long-lived one — a shared server
intermittently stalled past roughly 125 cumulative requests in testing; restarting per pass fixed
it. Explicit, different random seeds for warmup vs. the timed run. Cost =
GPU $/hr ÷ (output tok/s × 3600) × 1e6. - Quality check: 20-item fact-recall eval, RAG-shaped context blocks with one unique planted fact each, exact-substring-match scoring, bf16 vs FP8.
- Untouched-default and mechanism-breakdown passes: 75 timed requests per config, 3 passes, median reported.
--max-num-seqssweep: run twice. The first pass, at 75 requests/config (matching every other measurement in this post), showed 128/256/default tied — a confound, since none of those caps could bind against only 75 requests. The second pass, at 600 requests/config, resolved it; the real numbers are in the batch-sizing section above.